
17 Prioritization Frameworks Guide

Every product team faces the same problem: too many ideas, not enough time. Prioritization frameworks give you a structured way to decide what to build, fix, or ship next. They replace gut feeling with a repeatable process.
This guide covers the most useful prioritization frameworks, when to use each one, where each one fails, and how to choose the right approach for product, engineering, architecture, and portfolio decisions.
1. MoSCoW
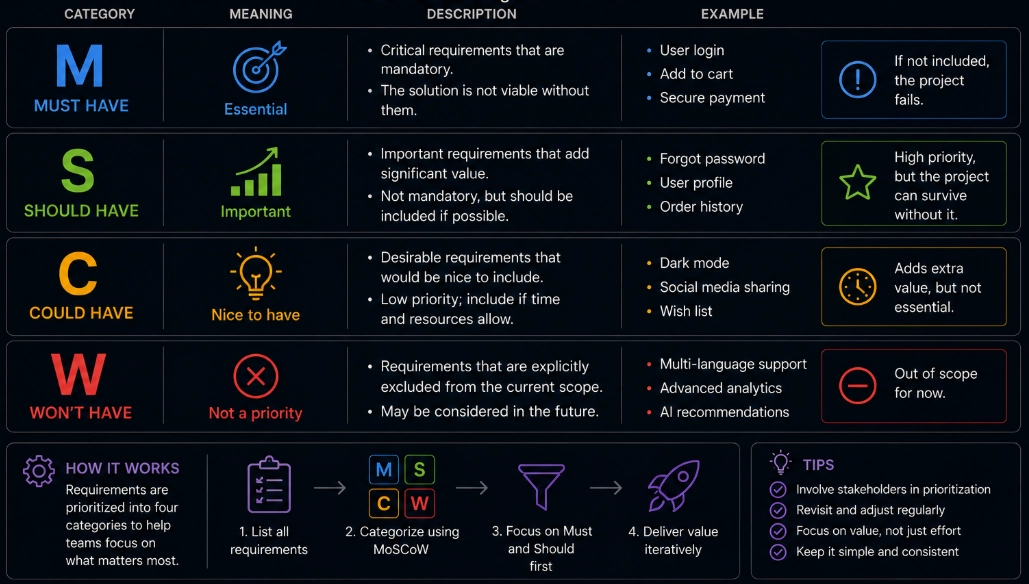
MoSCoW sorts work into four buckets:
- Must Have — non-negotiable. The product fails without these.
- Should Have — important, but not critical for launch.
- Could Have — useful to include if time permits.
- Won't Have — explicitly out of scope for this cycle.
Note:
"Won't Have" does not mean rejected forever. It means "not this cycle." Items in this bucket should be documented and revisited in future planning. Failing to communicate this causes stakeholder conflict — teams assume their ideas were killed, when they were simply deferred.
When to use MoSCoW
Use MoSCoW for release planning, scope negotiations, stakeholder discussions, and sprint kick-offs.
How to apply MoSCoW
List your backlog items. As a team, assign each item to one of the four categories. Be strict with Must Have. Most teams overfill this bucket, defeating the purpose of the framework.
MoSCoW breaks down when the PM assigns categories alone without stakeholder input. Run it as a group session. Have each stakeholder assign categories independently first, then discuss disagreements. Alignment on "Must Have" is more valuable than the list itself.
MoSCoW Limitation
MoSCoW is sorting, not ranking. Two Must Have items still compete with each other. Combine MoSCoW with effort estimates, RICE, or WSJF to break ties.
2. RICE
RICE scores each item numerically using four factors:
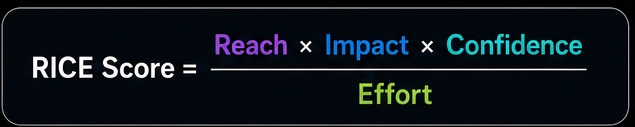
- Reach — how many users this affects per time period. Always use a consistent time window across all items — typically per quarter. "500 users" means nothing without a timeframe.
- Impact — how many users this affects per time period. Always use a consistent time window across all items — typically per quarter. "500 users" means nothing without a timeframe.
- Confidence — how sure you are about your estimates, expressed as a percentage. Anchor it: 100% = you have solid data, 80% = you have some signal, 50% = it is mostly a guess. Use lower confidence to penalize items built on weak assumptions.
- Effort — how much work is required, measured in person-months.
When to use RICE
Use RICE when comparing product features across a roadmap. It works best when you have usage data, customer data, or analytics to support your Reach and Impact estimates.
How to apply RICE
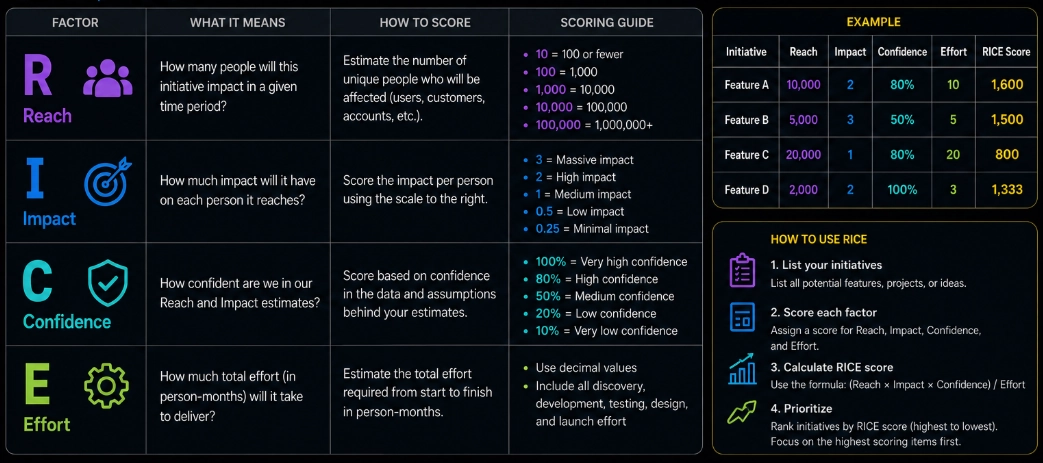
Score each candidate item. Sort by RICE score from highest to lowest. Higher scores usually go first.
RICE Example
RICE Limitation
RICE scores feel precise, but they depend on estimates. Treat the score as a decision input, not as the final decision.
3. ICE
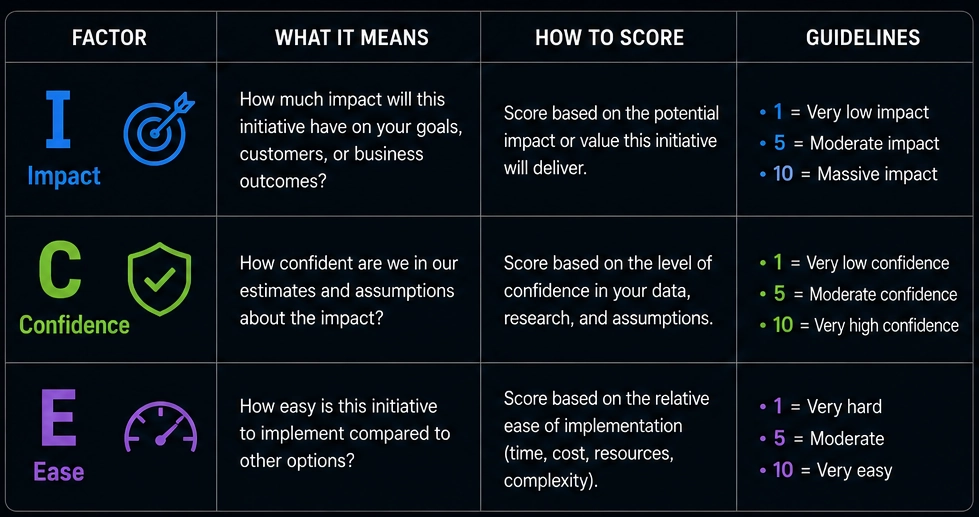
ICE is a lighter version of RICE. It works well when you do not have enough quantitative data.
Formula:
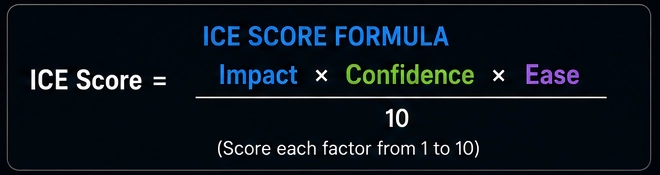
- Impact — how significant the expected outcome is.
- Confidence — how certain you are that the idea will work.
- Ease — how easy it is to implement.
Teams usually score each factor on a scale of 1 to 10.
When to use ICE
Use ICE for early-stage products, growth experiments, marketing campaigns, and quick internal decisions.
How to apply ICE
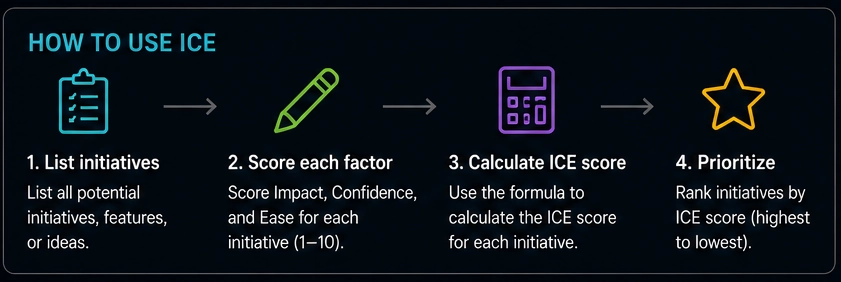
Score each item from 1 to 10 on Impact, Confidence, and Ease. Multiply the values. Sort by score.
ICE Limitation
ICE is subjective. The same person may score the same item differently on different days. More importantly, ICE scores should never be compared across teams without calibration. A "7 on Ease" means something completely different to a senior engineer than to a junior one. Run calibration sessions — score a few shared reference items together before scoring the full backlog.
4. WSJF
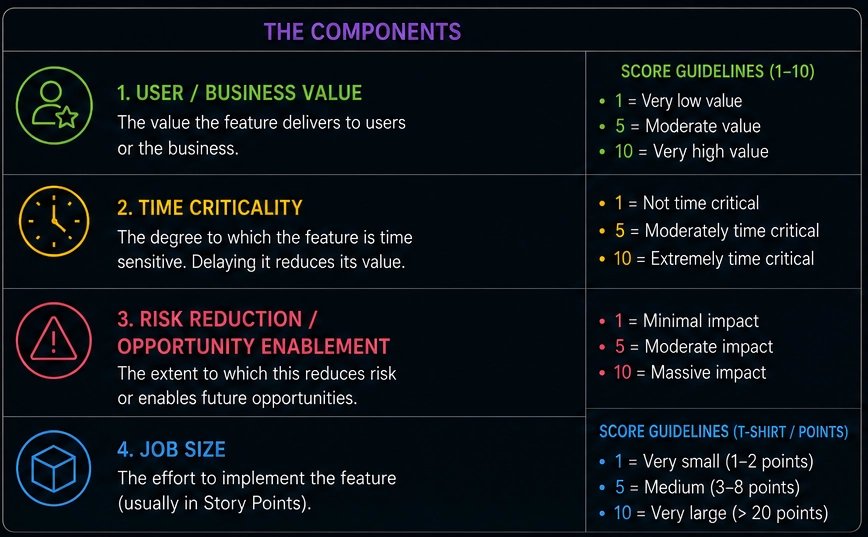
WSJF stands for Weighted Shortest Job First. It comes from SAFe and helps teams prioritize work that delivers the most value per unit of time.
Formula:
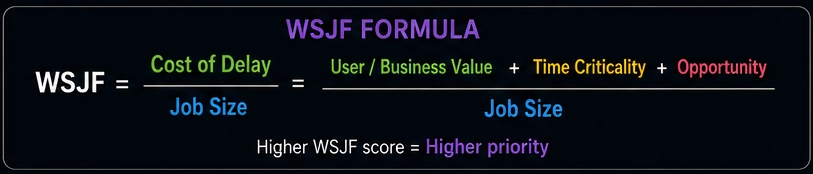
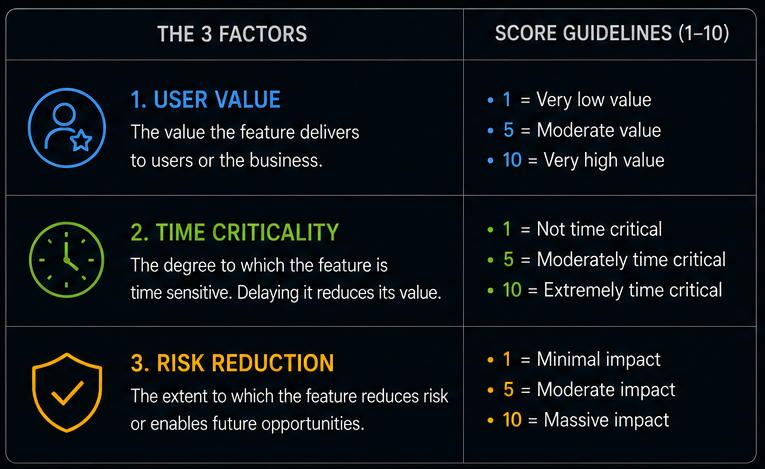
The cost of Delay usually combines three factors:
- User or business value
- Time criticality
- Risk reduction or opportunity enablement
Teams often score each factor using a Fibonacci scale: 1, 2, 3, 5, 8, 13, 20.
Why Fibonacci? Fibonacci forces relative thinking. Unlike a 1-10 scale where everything drifts to 6 or 7, Fibonacci creates meaningful gaps. You cannot place two items at "7." You have to decide whether something is a 5 or an 8, and that distinction drives real discussion. It also reflects how humans actually perceive differences: large items are harder to distinguish precisely than small ones.
When to use WSJF
Use WSJF for enterprise product teams, portfolio planning, platform work, and programs with multiple dependent work streams.
How to apply WSJF
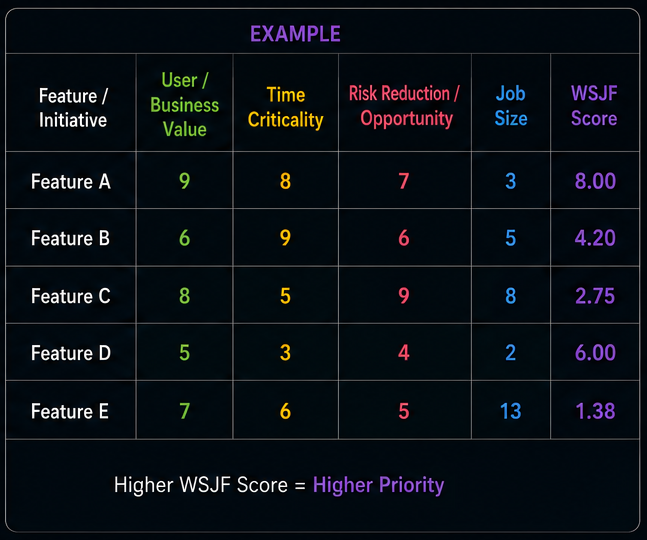
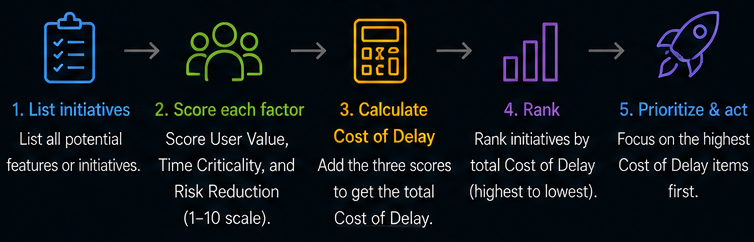
Score the three Cost of Delay components for each item. Add them together to get Cost of Delay. Estimate job duration on the same Fibonacci scale. Divide Cost of Delay by Job Duration. Prioritize the highest WSJF scores first.
WSJF requires a skilled facilitator. Without one, scoring sessions become political rather than analytical. Assign someone to challenge scores, ask for reasoning, and keep the session focused on trade-offs rather than advocacy.
WSJF Example
WSJF and Cost of Delay
WSJF is built on Cost of Delay (covered in the next section). Cost of Delay answers the question: "What do we lose by waiting?" WSJF normalizes that loss against the time it takes to deliver. Use Cost of Delay alone when you want to understand the economic impact without normalizing for duration. Use WSJF when you need to compare items of different sizes and want to sequence them optimally.
WSJF Limitation
WSJF has more overhead than simpler frameworks. It works best when teams understand the scoring model and have enough context to discuss business value, time criticality, and risk reduction.
5. Cost of Delay
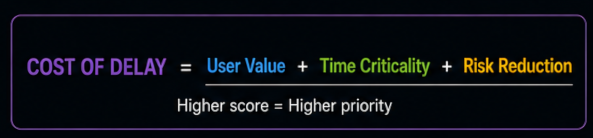
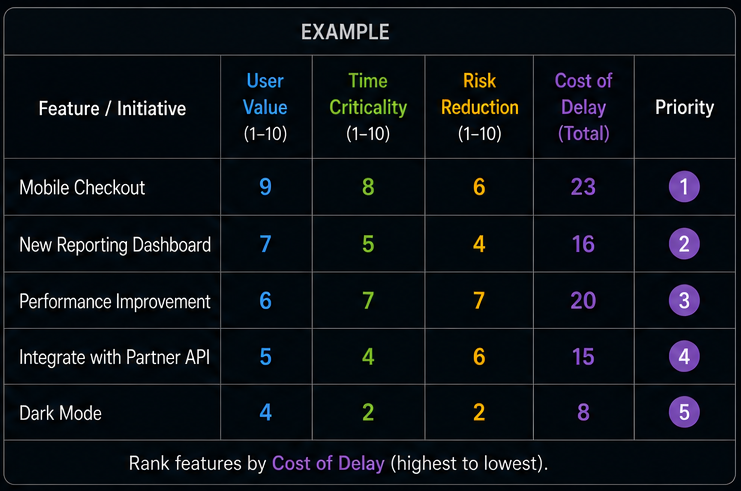
Cost of Delay measures the cost of not doing something now. It helps teams move from vague priority discussions to economic trade-offs.
Formula:
Instead of asking:
How important is this?
Cost of Delay asks:
What do we lose if we delay this by one week, one month, or one quarter?
Cost of Delay Example
When to use Cost of Delay
Use Cost of Delay for enterprise planning, commercial decisions, compliance work, operational risk, and initiatives where timing matters.
How to apply Cost of Delay
Estimate the economic impact of the delay. Compare initiatives based on expected loss, missed revenue, increased risk, or missed market opportunity.
Cost of Delay Limitation
Cost of Delay is difficult when teams lack financial data. Use ranges instead of inventing false precision. A range of $5,000–$20,000 per month is more honest and more useful than a confident guess of $12,500.
6. Value vs Effort Matrix
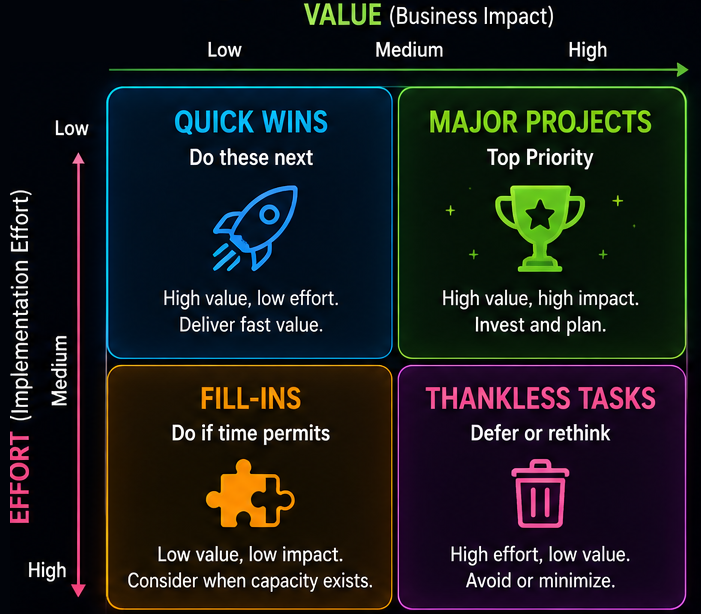
The Value vs Effort Matrix is a simple 2x2 prioritization tool. It plots work as a function of expected value and required effort.
- Quick Wins — high value, low effort. Do these first.
- Major Projects — high value, high effort. Plan and schedule these.
- Fill-ins — low value, low effort. Do so when capacity allows.
- Time Wasters — low value, high effort. Eliminate or defer indefinitely.
Defining "Value" before you start
The most common failure mode of this matrix is that two stakeholders place the same item in different quadrants because they define "value" differently. Before the session, align on what value means: business revenue, user satisfaction, strategic alignment, risk reduction, or a combination. Without this, the matrix produces noise rather than clarity.
When to use the Value vs Effort Matrix
Use it for workshops, stakeholder alignment, backlog grooming, and early prioritization sessions.
How to apply the Value vs Effort Matrix
Write each candidate item on a card. Place each card on the matrix. Discuss placement as a group. Items in the high-value, low-effort quadrant become the first priority candidates.
Value vs Effort Matrix Limitation
Value and effort are coarse dimensions. Two items in the same quadrant still need a tiebreaker. Use RICE or ICE to rank within quadrants if needed.
7. Eisenhower Matrix
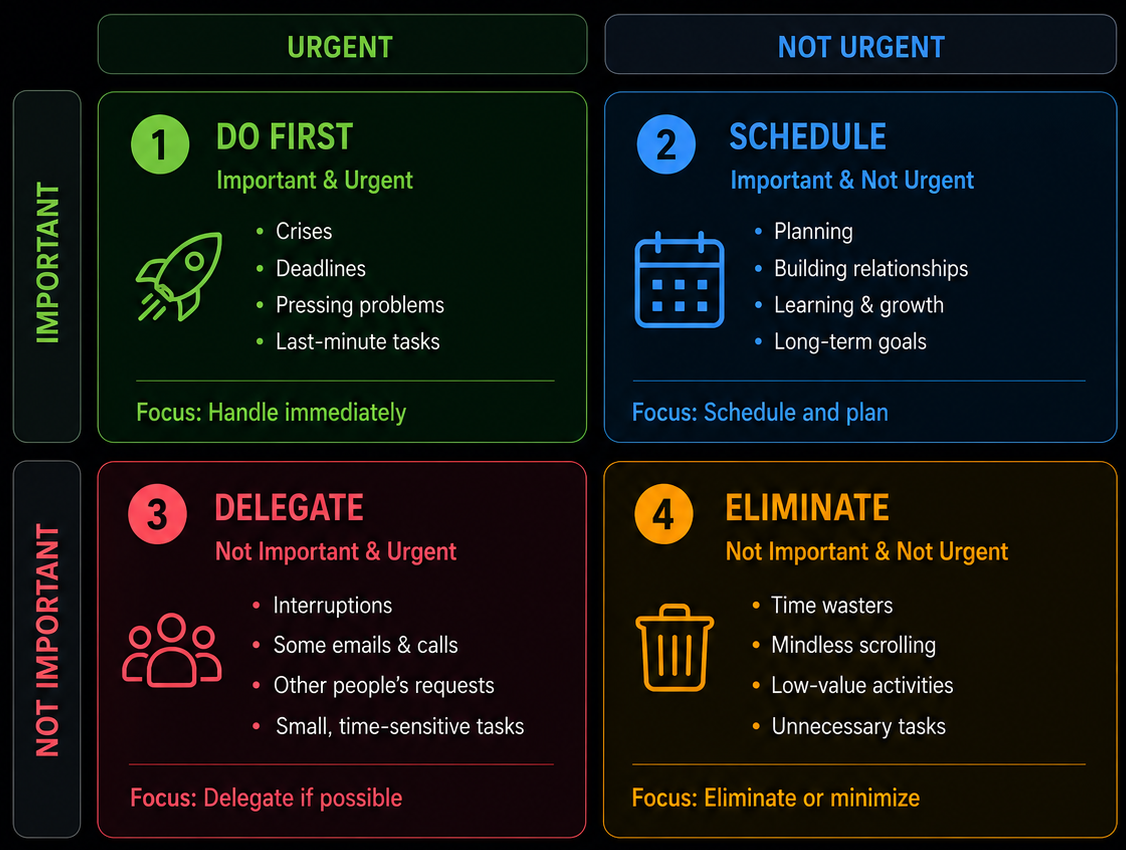
The Eisenhower Matrix uses urgency and importance as its two axes, which makes it visually similar to the Value vs. Effort Matrix but fundamentally different in purpose.
The delegation quadrant — "urgent but not important" — is frequently ignored. These tasks demand attention but do not require the most senior person in the room to handle them. Identifying and delegating this work is one of the most practical benefits of the Eisenhower approach for leaders.
When to use the Eisenhower Matrix
Use it for personal productivity, leadership workload management, operational triage, and daily planning.
How to apply the Eisenhower Matrix
List tasks. Decide whether each one is important, urgent, both, or neither. Then act based on the quadrant.
Eisenhower Matrix Limitation
The Eisenhower Matrix is less useful for product roadmap prioritization because product work typically requires analysis of value, effort, risk, strategy, and customer impact.
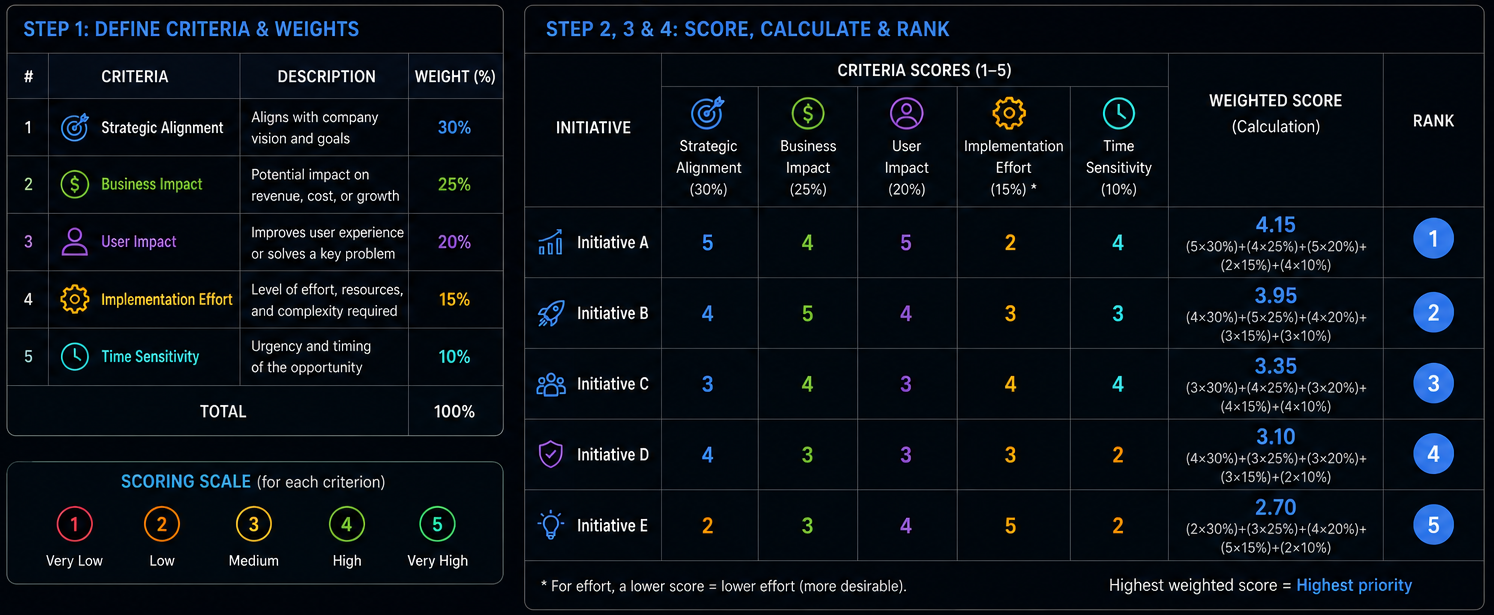
8. Weighted Scoring Model
Weighted Scoring evaluates items against multiple criteria. Each criterion carries a weight, and items are ranked by total weighted score.
Steps
- Define your criteria. Involve cross-functional stakeholders — engineering, design, sales, support — to ensure the criteria reflect real constraints, not just PM preferences. Aim for 3–6 criteria. More than six introduces noise and makes scoring sessions unwieldy.
- Assign a weight to each criterion so the total equals 100%.
- Score each item from 1 to 5 or 1 to 10 on each criterion.
- Multiply each score by its weight.
- Sum the weighted scores.
- Rank items by total score.
Example
When to use it
Use Weighted Scoring when multiple stakeholders prioritize different goals, and you need a transparent ranking process.
Limitation
Weight selection is often political. Different teams may push weights that favor their own initiatives. Make weights explicit and document why they were selected.
9. Risk-Based Prioritization
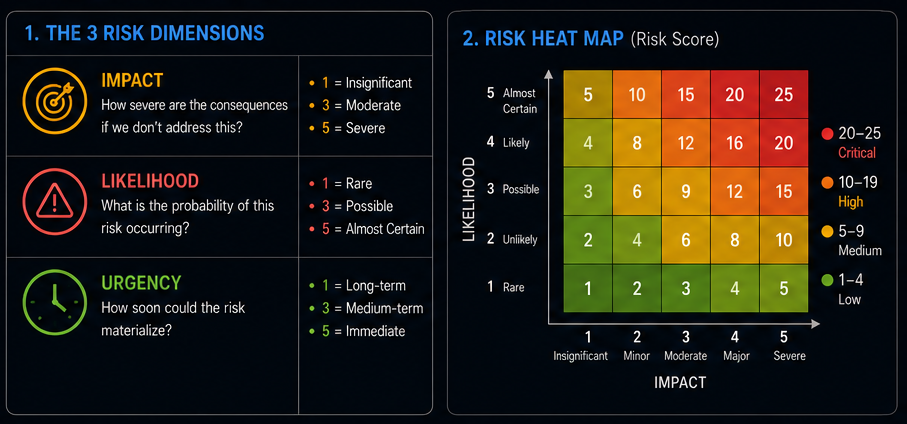
Risk-Based Prioritization sequences work based on uncertainty and downside. It helps teams address dangerous assumptions early.
Formula:

Risk types
Not all risk is the same. Treating them the same leads to poor scoring:
- Technical risk — will the solution actually work? (new technology, architectural unknowns)
- Market risk — will users want it? (unvalidated assumptions about demand or behavior)
- Compliance risk — are we exposed to legal or regulatory risks?
- Delivery risk — can the team ship it on time with available capacity?
Mitigation vs. avoidance
Some high-risk items should not be prioritized to the top of the backlog — they should be de-risked first through spikes, prototypes, or pilots. A technical spike that reduces uncertainty from a 5 to a 2 on probability may be more valuable than building the full feature immediately. Prioritize de-risking work separately from delivery work.
When to use Risk-Based Prioritization
Use it for technical projects, regulated industries, security work, safety-critical systems, infrastructure changes, and new product exploration.
How to apply Risk-Based Prioritization
- Identify the risks behind each item or initiative.
- Score probability and impact from 1 to 5.
- Calculate risk score.
- Prioritize high-probability, high-impact risks first.
Risk-Based Prioritization Limitation
Teams systematically underestimate probability. Use historical incidents, production data, pre-mortems, and external benchmarks to improve scoring quality. If your team has never shipped a machine learning feature before, a "1 on probability of failure" is almost certainly wrong.
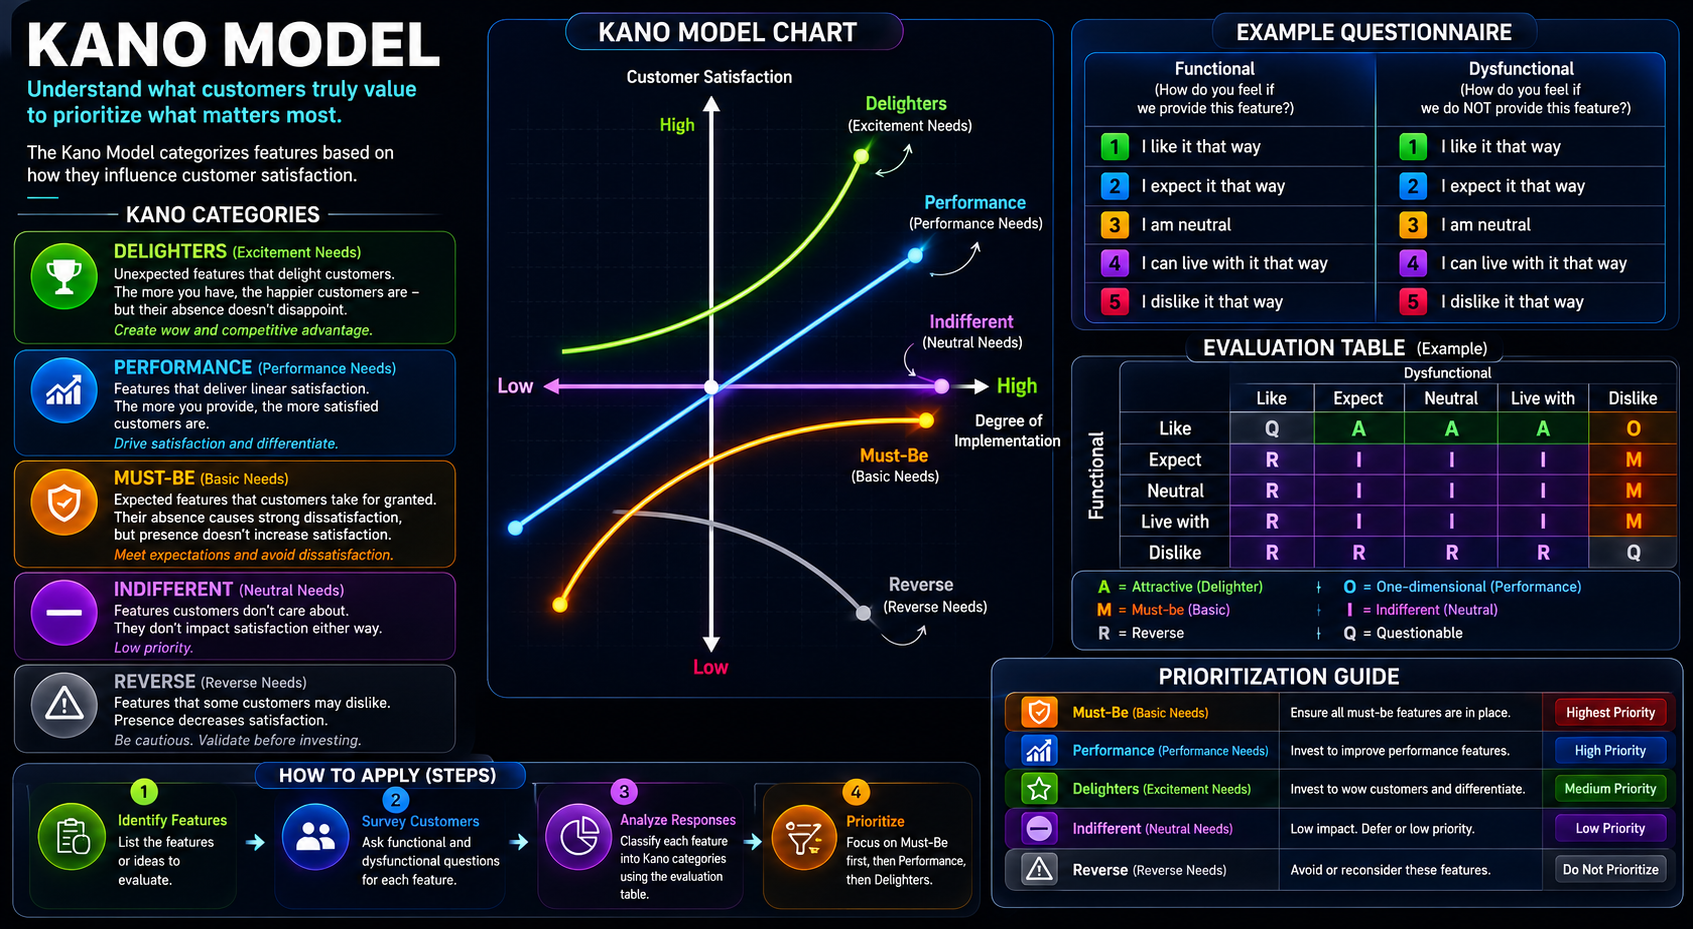
10. Kano Model
The Kano Model categorizes features by their effect on customer satisfaction. It was developed by Noriaki Kano in the 1980s.
When to use the Kano Model
Use Kano during discovery, customer research, UX planning, and feature investment discussions.
How to apply the Kano Model
- Create paired questions for each feature.
- Ask how users feel about the feature if it exists.
- Ask how users feel if the feature does not exist.
- Map the answer pairs to Kano categories.
- Prioritize Must-Be features first, then Performance features, then selected Attractive features.
Kano Model Limitation
Kano requires customer research. Categories also change over time. What once delighted users may later become expected.
11. Opportunity Scoring
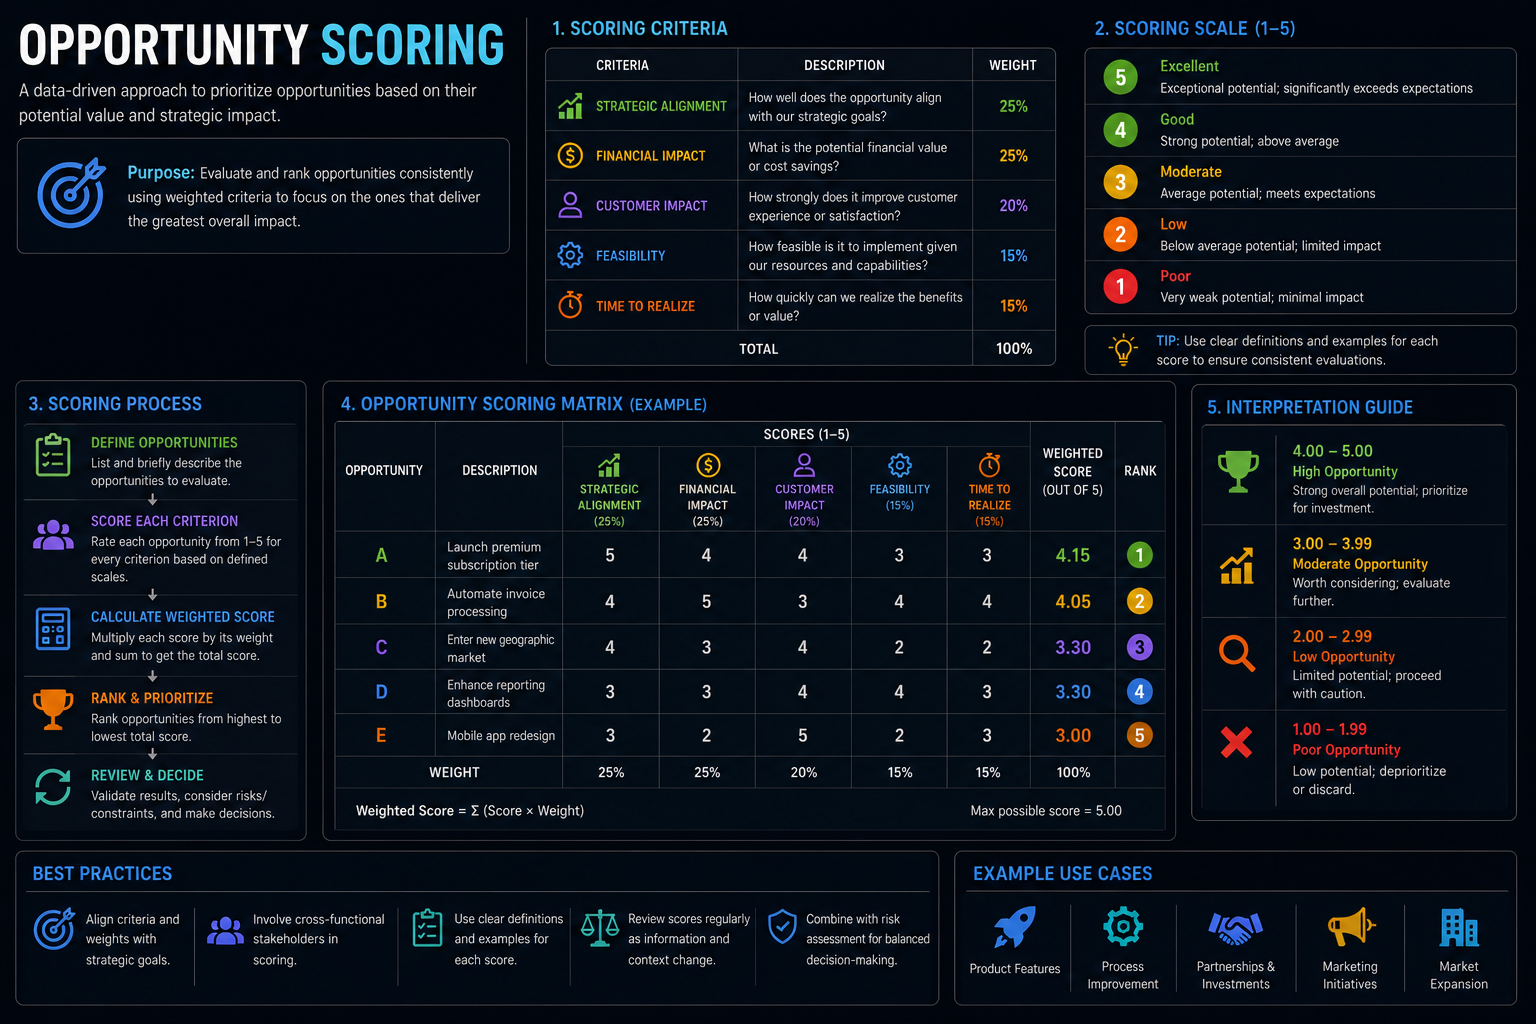
Opportunity Scoring helps teams identify gaps between what users consider important and their current satisfaction.
Opportunity = Importance + (Importance - Satisfaction)A high score indicates a strong opportunity — something users care about deeply but are not getting from the current solution.
The logic across all combinations:
- High importance + low satisfaction → strong opportunity (underserved need)
- High importance + high satisfaction → maintain quality (no gap to exploit)
- Low importance + low satisfaction → weak opportunity (users don't care)
- Low importance + high satisfaction → possible overinvestment (consider reducing)
When to use Opportunity Scoring
Use Opportunity Scoring for product discovery, UX improvements, customer research, and roadmap planning.
How to apply Opportunity Scoring
Ask users to rate how important a capability is and how satisfied they are with the current solution. Prioritize areas with high importance and low satisfaction.
Opportunity Scoring Limitation
Survey design matters. Users may overstate importance if every question sounds important. Combine survey data, usage data, and interviews.
12. Technical Debt Prioritization
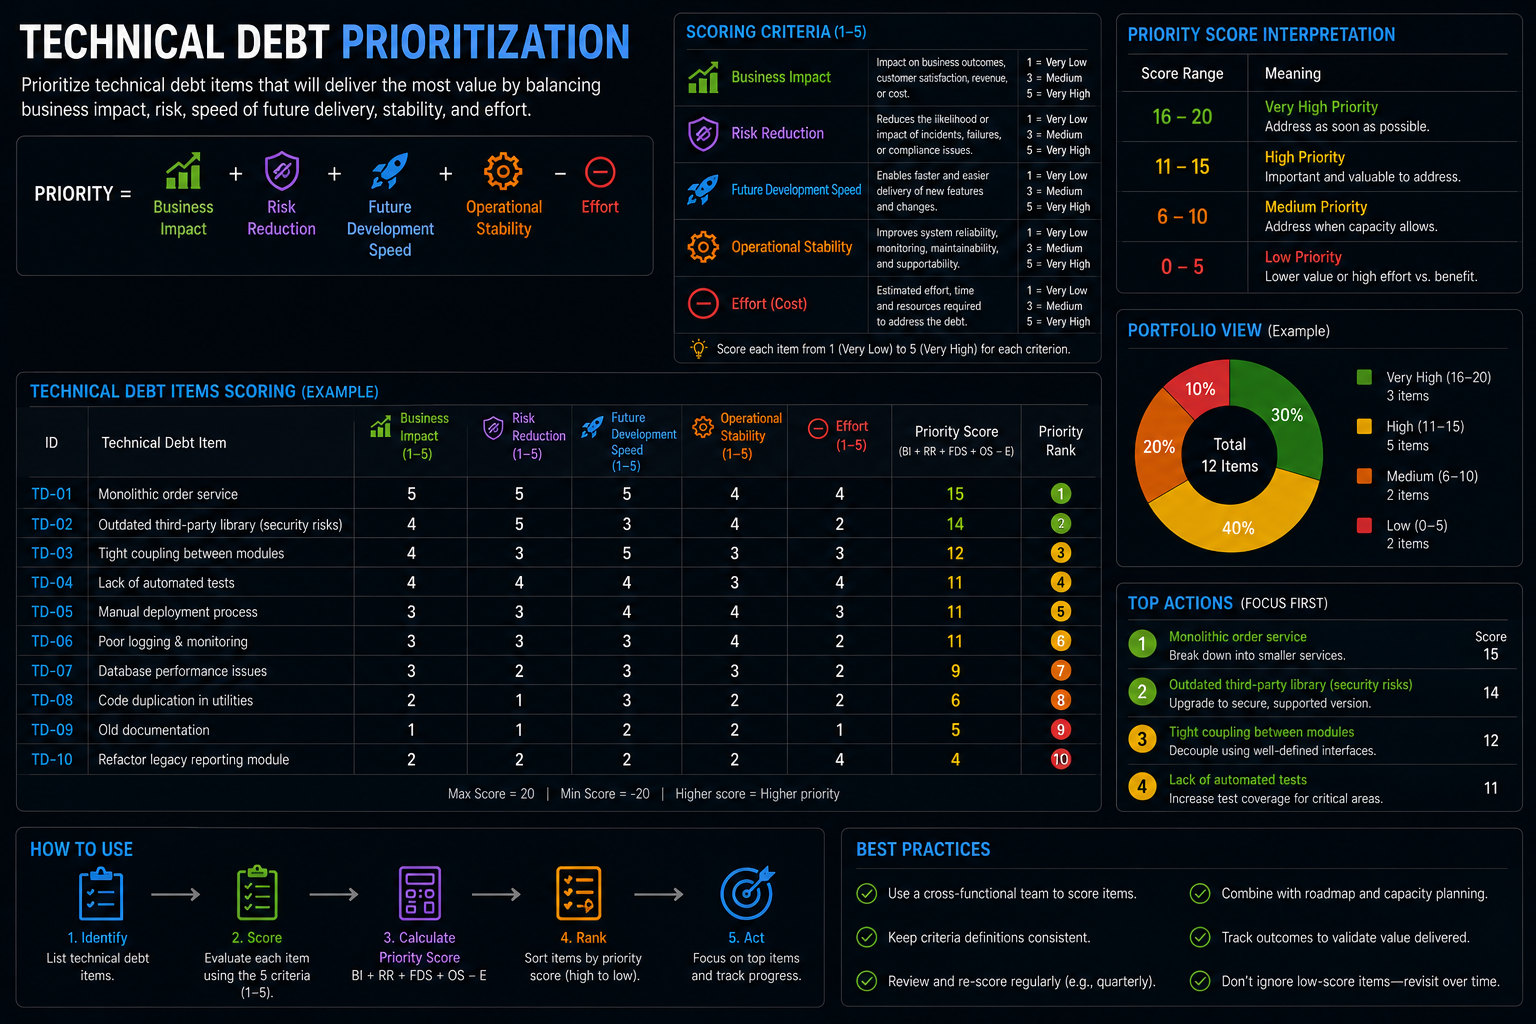
Standard product prioritization frameworks often fail for technical debt. Technical debt has indirect value — it rarely increases revenue immediately, but it affects delivery speed, reliability, security, and operational risk. The challenge is translating that indirect value into terms that non-technical stakeholders can act on.
Common criteria
| Criterion | Question |
|---|---|
| Business impact | Does this debt slow down important product work? |
| Risk reduction | Does this reduce outage, security, compliance, or data risk? |
| Future development speed | Will this make future changes faster or safer? |
| Operational stability | Will this reduce incidents, alerts, manual work, or support load? |
| Effort | How hard is it to fix? |
Making debt visible to non-technical stakeholders
Connect debt to business language:
- "This module causes 3–4 incidents per quarter, each requiring 6 hours of engineer time to resolve."
- "Every new feature in this area takes 40% longer than it should because of how this layer is structured."
- "We cannot pass a SOC 2 audit with this component in its current state."
Framing debt as a delivery cost, an incident cost, or a compliance risk is far more effective than framing it as code quality.
When to use Technical Debt Prioritization
Use it for refactoring, platform modernization, reliability work, security improvements, test automation, and performance work.
Technical Debt Prioritization Limitation
Technical debt is often invisible to non-technical stakeholders. Tie debt to delivery impact, incident history, support cost, or measurable risk.
13. Prioritizing Architecture Work
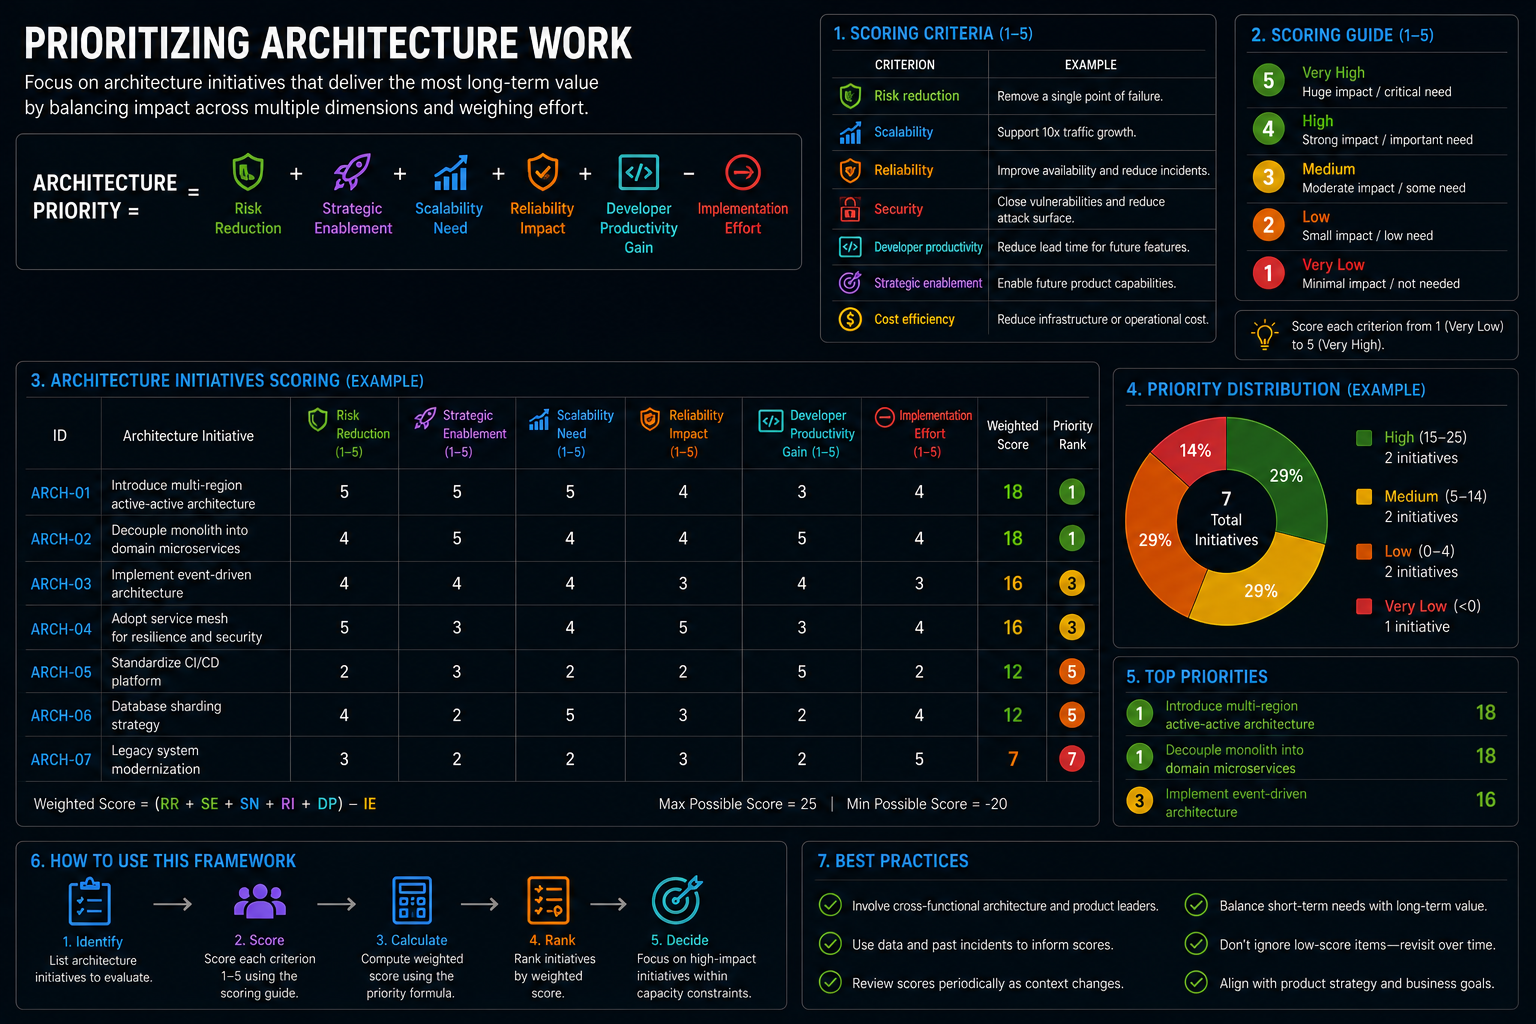
Architecture work is hard to prioritize with feature-based frameworks because its value is often indirect. Reach is difficult to estimate. User impact may appear later. Benefits often show up as scalability, resilience, cost control, security, or delivery speed.
Connecting architecture to business outcomes
Architecture work competes poorly against visible product features unless the cost of inaction is made explicit. Use concrete framing:
- "Our current database cannot support the volume we project for Q3 without degraded response times."
- "The monolith deployment model means every release requires 4 hours of coordinated downtime."
- "We cannot onboard enterprise clients without multi-tenancy isolation."
When to use Prioritizing Architecture Work
Use this approach for platform roadmaps, modernization, cloud migration, distributed system design, scalability planning, and reliability improvements.
Prioritizing Architecture Work Limitation
Architecture work competes poorly against visible product features unless the team explains the cost of not doing it. Connect architecture initiatives to business outcomes, delivery blockers, incident data, or future roadmap needs.
14. PIE
PIE is common in growth and conversion optimization work.
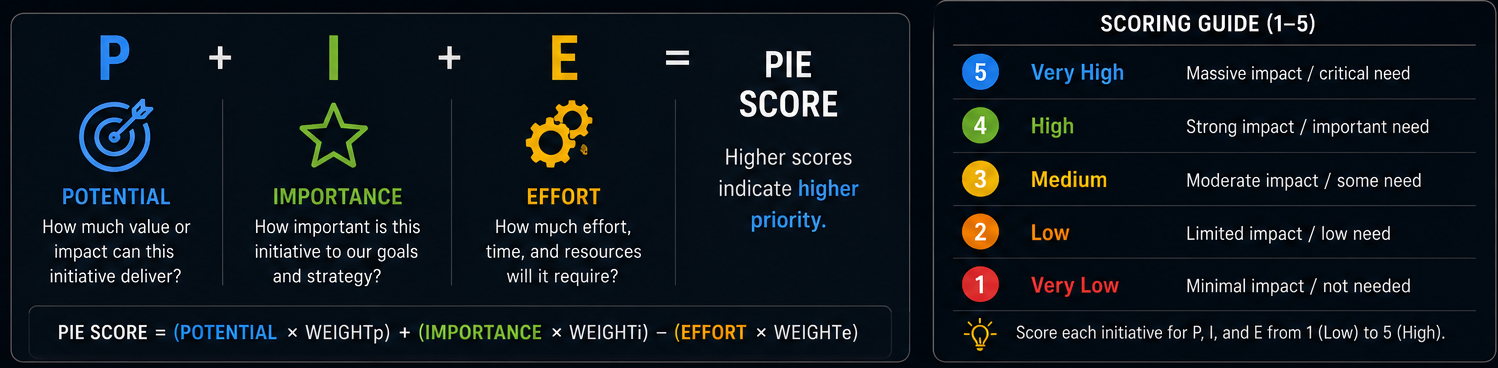
It uses three factors:
- Potential — how much improvement this idea could create.
- Importance — the value of the affected area.
- Ease — how easy the idea is to implement or test.
Example PIE scoring:
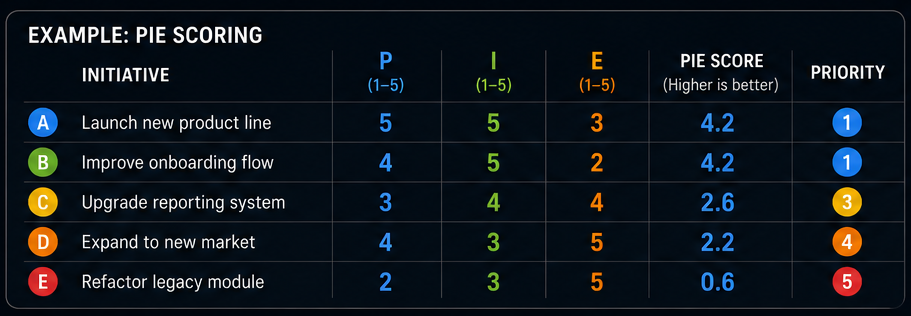
When to use PIE
Use PIE for A/B tests, landing pages, onboarding flows, conversion funnels, and growth experiments.
PIE Limitation
PIE works best for optimization. It is less useful for strategic product or architecture decisions.
15. Buy a Feature
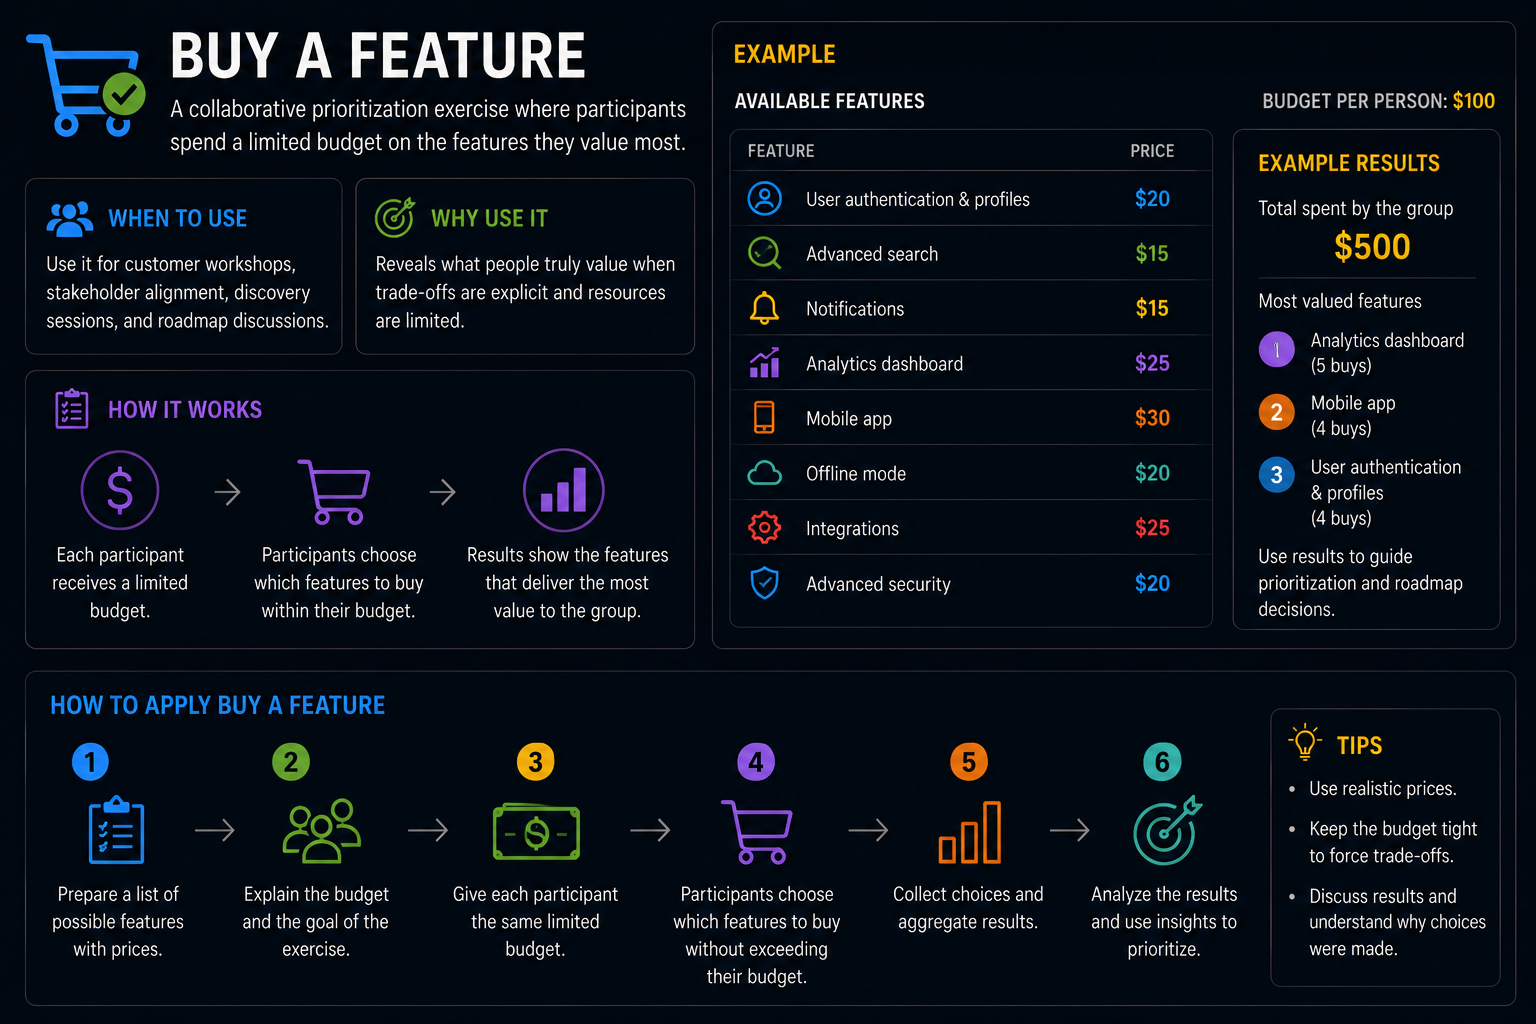
Buy a Feature is a collaborative prioritization exercise. Participants receive a limited budget and spend it on the features they value most. Because budgets are constrained, participants are forced to make trade-offs, which reveals genuine preference more accurately than asking people to rate or rank items in isolation.
How to set feature prices
Pricing is where Buy a Feature most commonly breaks. If all features cost the same, participants cannot signal the intensity of their preference. If prices vary too wildly, one feature wins by default. A useful approach: price features relative to rough development effort or complexity. A simple feature might cost $50, a medium one $150, and a complex one $250. Give each participant a budget of roughly $500. This forces meaningful choices without making the exercise inaccessible.
When to use Buy a Feature
Use it for customer workshops, stakeholder alignment, discovery sessions, and roadmap discussions.
How to apply Buy a Feature
Give participants a list of possible features with prices. Each participant receives a limited budget. They decide what to buy. Debrief on what was purchased, what was left on the table, and why. Use purchasing patterns to identify consensus items and polarizing ones.
Buy a Feature Limitation
The result depends heavily on the group in the room. Use it as qualitative input, not as the only prioritization method.
16. Affinity Mapping
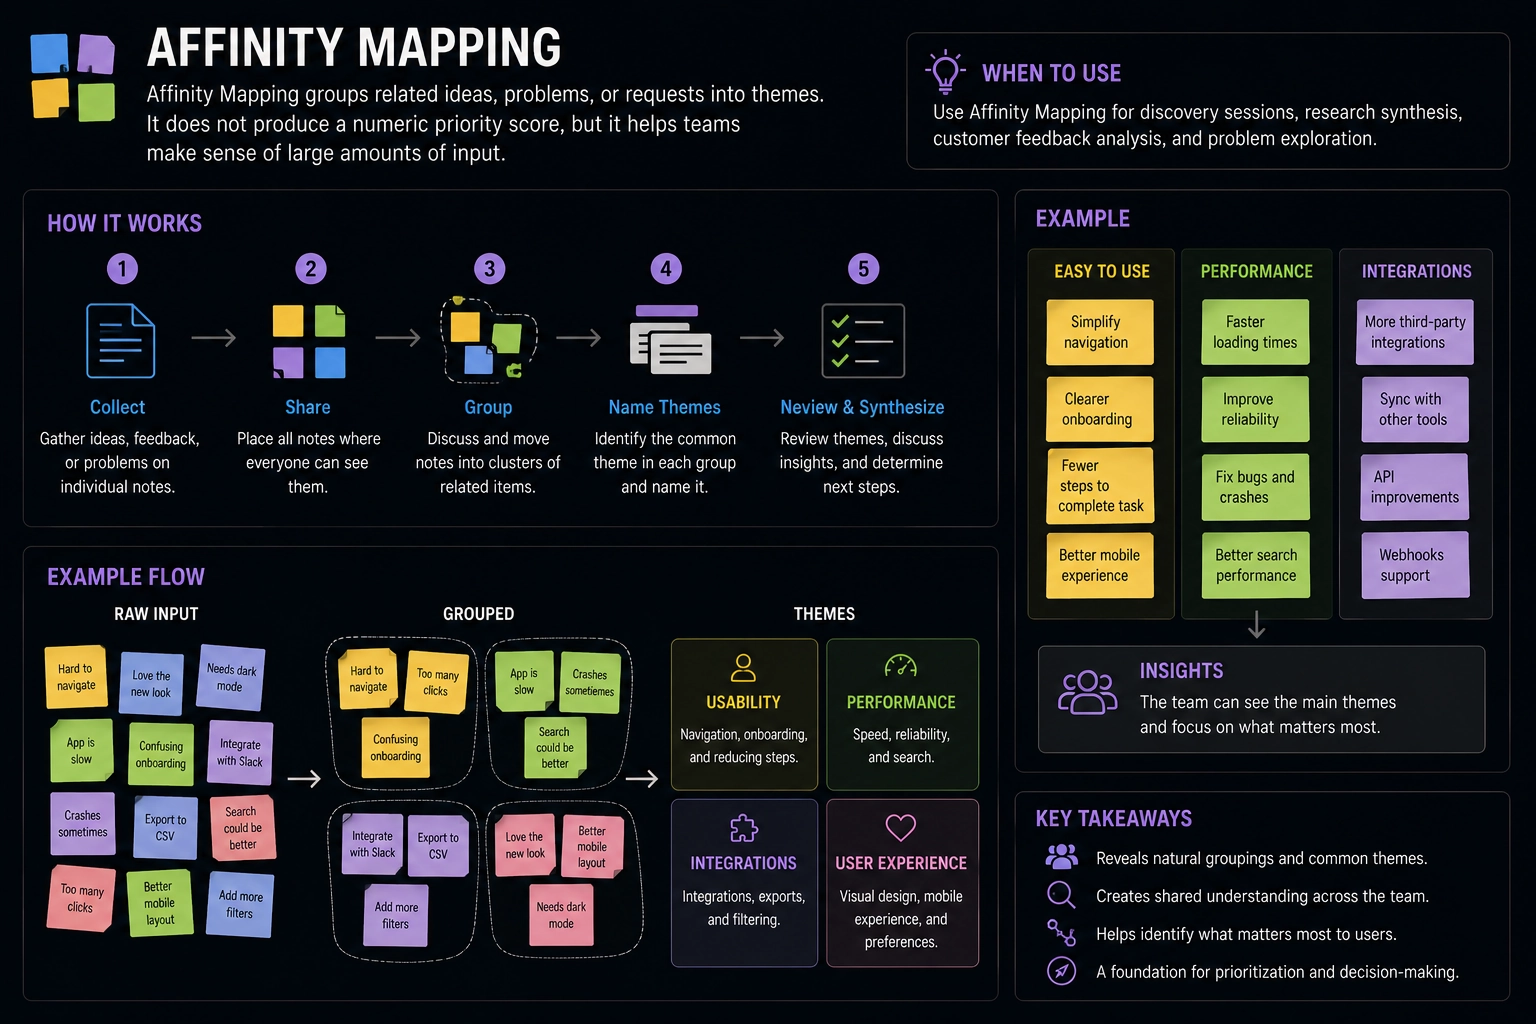
Affinity Mapping groups related ideas, problems, or requests into themes. It does not produce a numeric priority score, but it helps teams make sense of large amounts of input.
When to use Affinity Mapping
Use it after user interviews, support ticket reviews, discovery workshops, retrospectives, and stakeholder brainstorming.
How to apply Affinity Mapping
Write each insight or idea on a separate card. Group related cards. Name each group. Prioritize themes instead of isolated items.
Affinity Mapping Limitation
Affinity Mapping helps structure information, but it does not rank work on its own. Combine it with RICE, Opportunity Scoring, or Weighted Scoring.
17. Jobs-to-be-Done Prioritization
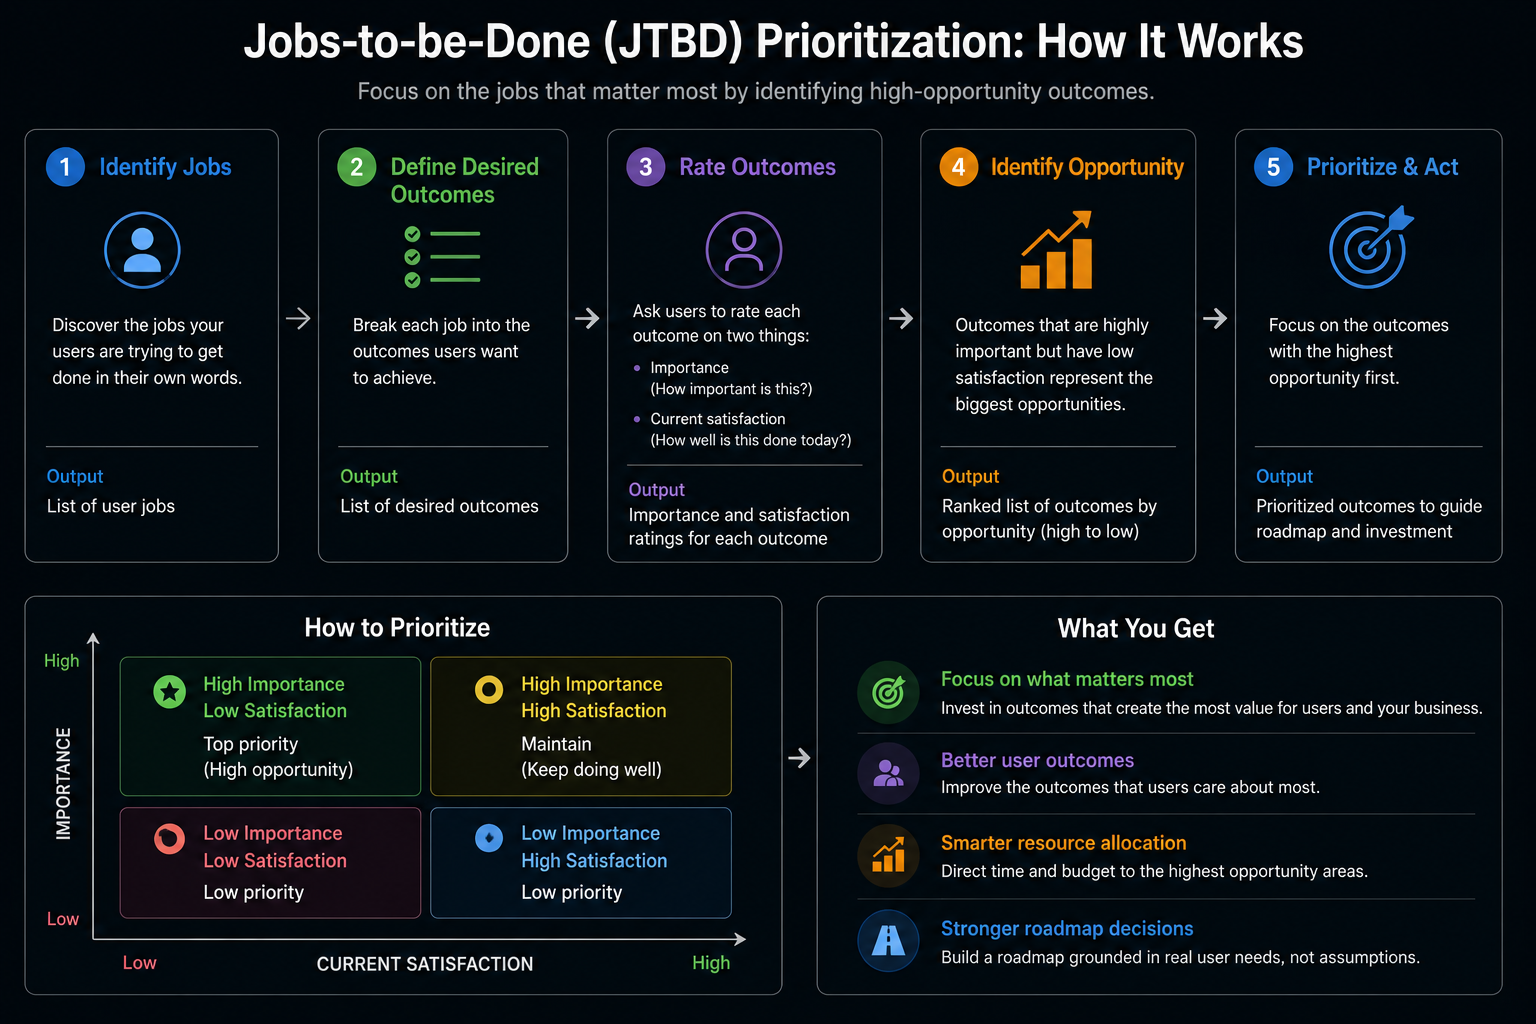
Jobs-to-be-Done (JTBD) prioritization focuses on the outcomes users want to achieve rather than the features they request.
Instead of asking:
What feature should we build?
It asks:
What job is the user trying to get done, and where does the current solution fail?
JTBD is a research method that feeds into prioritization frameworks rather than replacing them. It tells you what to prioritize by clarifying which user outcomes matter most. The actual ranking of initiatives still requires RICE, Opportunity Scoring, Weighted Scoring, or another framework.
When to use Jobs-to-be-Done
Use it for product discovery, market research, customer segmentation, innovation, and feature strategy.
How to apply Jobs-to-be-Done
Identify the user's job (what they are trying to accomplish), their desired outcome (how they measure success), their current pain (where the existing solution fails), and their satisfaction level. Prioritize jobs that are important to users, currently underserved, and aligned with business strategy. Then feed these jobs into Opportunity Scoring or Weighted Scoring to rank them.
Jobs-to-be-Done Limitation
JTBD requires quality research. Poor interview technique leads to vague jobs ("I want to be more productive") that cannot be acted on. Train interviewers, use structured interview guides, and triangulate findings across multiple users before treating a job as validated.
Choosing the Right Framework
No single framework fits every situation. Use this table as a starting point.
| Situation | Recommended Framework |
|---|---|
| Planning a release with mixed stakeholders | MoSCoW |
| Comparing product features with usage data | RICE |
| Scoring growth experiments quickly | ICE or PIE |
| Enterprise portfolio planning | WSJF or Weighted Scoring |
| Timing-sensitive business decisions | Cost of Delay |
| Visual workshop with a team | Value vs Effort Matrix |
| Personal or leadership workload planning | Eisenhower Matrix |
| Multi-criteria decisions with many stakeholders | Weighted Scoring Model |
| High-uncertainty technical projects | Risk-Based Prioritization |
| Customer satisfaction and emotional response | Kano Model |
| Finding underserved customer needs | Opportunity Scoring |
| Refactoring, reliability, security, or platform work | Technical Debt Prioritization |
| Architecture roadmap planning | Architecture Priority Model |
| Customer or stakeholder trade-off workshops | Buy a Feature |
| Large sets of ideas or research notes | Affinity Mapping |
| Outcome-driven product strategy | Jobs-to-be-Done Prioritization |
Common Prioritization Mistakes
Treating scores as the objective truth
A RICE score of 450 is not automatically better than a RICE score of 440. The score depends on assumptions. Use scores to support discussion, not to replace judgment.
Gaming the inputs
Teams may inflate Reach, Impact, business value, or risk reduction to make their own work look more important. Ask teams to explain their numbers and, where possible, show evidence. "How did you arrive at 500 users per quarter?" is a more productive question than accepting the number at face value.
Ignoring strategic alignment
A feature with a high score may still be the wrong choice if it does not support the current strategy. Always check whether the work supports business goals — frameworks optimize within a strategy, they do not define one.
Mixing different types of work without context
Product features, compliance fixes, security work, technical debt, and architecture initiatives do not create value in the same way. One scoring model applied uniformly to all of them will consistently disadvantage technical and risk-reduction work relative to visible features. Use separate scoring tracks or adjust criteria per work type.
Re-scoring too frequently
Constant re-prioritization creates churn and erodes team trust. Revisit priorities when strategy, data, deadlines, or capacity change significantly. Do not restart the prioritization process every week without a clear reason.
Ignoring dependencies
A lower-scoring item may need to happen first because other work depends on it. Prioritization must account for sequencing, not only value. A dependency map alongside a priority list prevents costly sequencing errors.
Confusing urgency with importance
Urgent work demands attention now. Important work creates meaningful value. They are not the same thing. Good prioritization separates the two and protects time for important, non-urgent work — where most strategic value is built.
Prioritizing in isolation
Roadmap decisions made by a single person or team, without cross-functional input, often overlook critical constraints. Engineering knows what is technically risky. Sales knows what customers are asking for. Support knows what is causing churn. Prioritization should be a structured cross-functional conversation, not a solo PM exercise.
Not communicating what was deprioritized and why
Teams that only announce what they are building create confusion about what they are not building. Stakeholders repeatedly raise deprioritized items because there is no shared record of the decision. Maintain a visible "not now" list with documented rationale. This reduces repeated conversation